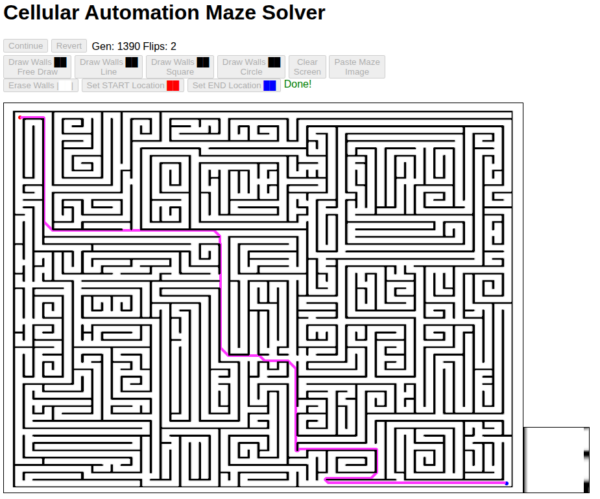
Here is THE fastest and most computationally-efficient circle algorithm.
Archives
All posts by Justin A. Parr
Building Data Centers in space is stupid. Here’s why…
As a practical joke, I’m making an eye test chart for a friend. However, apparently there is no “one standard” for font sizes on an eye test chart (called a Snellen acuity test chart), and the details are a giant secret.
Well, for anyone who has ever wanted to make an eye test chart, HERE are the specifications.
| Warning:
This is not medical advice – always consult a licensed medical professional who will use actual medical equipment. My version of the “eye chart” constitutes a joke and is not intended for medical use. |
First of all, there is a free OpenType font called “Optician”. Google for it, download for free, and put it in your Windows/system32/fonts or /usr/share/fonts/opentype folder.
Second, here are the font sizes:
| Row | Distance | Font Size | Sample (size only) | Symbols | Char Spacing | Spaces |
|---|---|---|---|---|---|---|
| 1 | 20/200 | 155pt |
A
|
1 | n/a | n/a |
| 2 | 20/100 | 102pt |
A
|
2 | 84pt | 2 |
| 3 | 20/70 | 72pt |
A
|
3 | 57pt | 2 |
| 4 | 20/50 | 52pt |
A
|
4 | 39pt | 2 |
| 5 | 20/40 | 41pt |
A
|
5 | 32pt | 2 |
| 6 | 20/30 | 30pt |
A
|
6 | 31pt | 2 |
| 7 | 20/25 | 26pt |
A
|
7 | 24pt | 2 |
| 8 | 20/20 | 20pt |
A
|
8 | 18pt | 2 |
| 9 | 20/15 | 15pt |
A
|
8 | 25pt | 2 |
| 10 | 20/13 | 12pt |
A
|
8 | 20pt | 2 |
| 11 | 20/10 | 9pt |
A
|
8 | 16pt | 2 |
- Font Size – set your font size to this, for each row
- Symbols – number of letters on each row
- Character Spacing – Set your font size to this, and use TWO spaces between letters.
For example, on row 5:
- 5 letters
- Letter font size: 41pt
- Spaces font size: 32pt (use two spaces between letters)
Congratulations! Now you can make your own eye chart whenever you want, and it’s no longer a secret.
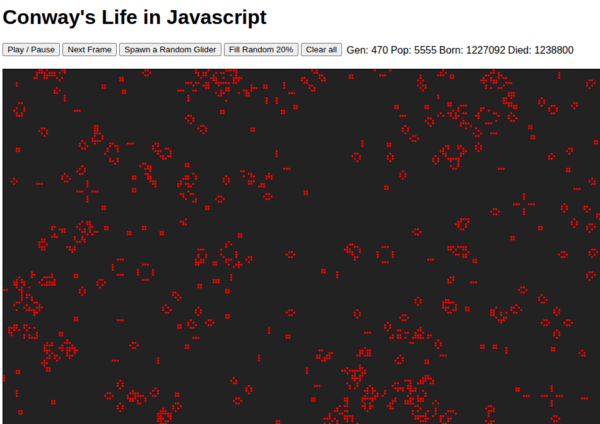
Conway’s “Game of Life” Implemented in Javascript

Click here to play:
Instructions:
- Click the “Fill Random” button
- Click the “Play / Pause” button
- If things get boring, click “Spawn a Random Glider”
What is Game of Life?
Each cell has 8 neighbors. Based on the number of neighbors:
- If a cell has more than 3 neighbors, it dies of overcrowding
- If a cell has fewer than 2 neighbors (1 or 0) it dies of loneliness
- If a dead cell has exactly 3 neighbors, a new cell is born
- If a cell has 2 or 3 neighbors, it continues to the next generation
Each “generation” results in these rules being applied to every cell on the game board, resulting in a new game board. The new game board is then analyzed to produce the next generation, and so-forth.
The point of all of this, is that a few simple rules can create amazing complexity.
When mathematician John Conway came up with this in the 1970’s, it became extremely popular, despite having to be largely computed by hand on graph paper. John Conway, who passed away in 2020 at age 82, is known for dozens of innovations in math, science, and computer science.

I accidentally figured out how to make compute-expensive blobs in JavaScript using fillRect(). And….how to fix it.
Convert WiFi RSSI to Signal Bars (Formula and Code Snippet)
I went way down the rabbit hole trying to convert RSSI (in dBm) to a useful signal strength meter, like you’d see on your cell phone.
I read many articles, but no one really had an algorithm. So….here is an algorithm written in Javascript.
The Goods
//This assumes you have a way to obtain rssi... in my application,
// this is the rssi for the web server's connection (IoT device).
function rssiToBars( rssi , maxbars ){
var ret=rssi+80; //Useful range is -80 (bad) to -30 (good).
//+50 converts this to a useful range of 0 (bad) to 50 (good)
ret=(ret< 0)?0:rssi; //Clamping
ret=(ret>50)?50:rssi;
ret=parseInt(ret*maxbars/50); //taking a percent (rssi/50) of maxbars
// If you are using a language with integer data types, make sure you multiply
// first, then divide.
return(ret);
}
function rssiMeter( bars , maxbars ){
return("<PRE>[" + "#".reapeat(bars) + "-".repeat(maxbars-bars) + "]</PRE>");
//This is a simple example, but you could stack a couple of small PNG or
//render a table where the cells are bars.
}
const maxbars=8
var rssi=-55; //some magical way to get the rssi
var bars=rssiToBars(rssi,maxbars);
var meter=rssiMeter( bars , maxbars);
// rssi == -55
// bars == 4
// meter == <PRE>[####---]</PRE>
How It Works
Received Signal Strength Indicator (RSSI) is the relative signal strength of a transmitter, from the receiver’s perspective.
RSSI is measured in dBm, or Decibel-milliWatts. Basically, this is milliWatts as perceived by the receiver, but represented on a logarithmic scale.
Because power drops inversely with the square of the distance, a logarithmic scale more or less represents this as a linear scale, rather than exponential.
For example, if you have signal strength of -30 (very good) and you walk 50 feet away with no obstacles between you and the router, you might drop to -40 dBm. If you walk another 50 feet, you would expect the signal to drop to -50 dBm. This a super-simple example, and there are a lot of other factors involved, but you get the basic idea.
The algorithm works like this:
- Convert rssi to a useful scale. We do this by adding 80. If we start with a range of -30 (good) to -80 (bad) and add 30, we get 0 (good) to -50 (bad). Further if we add 50, we get a positive integer that is now reversed: -50+50==0 (bad) and 0+50==50 (good).
- Next, we clamp the values to prevent unexpected results, ensuring we now have an integer in the range of 0..50.
- Dividing this number by 50 yields a percentage (0..1)
- Multiplying the percentage by the max number of bars, gives you the number of bars. For example, .5 * 8 (medium signal strength * 8 bars) == 4.
- If using a typed language such as c++, be sure to multiply first, THEN divide: (rssi+50)*maxbars/50. If not, the CPU will perform int math, and bars will be zero most of the time.
Rendering can be done however you want. One slick trick is to use CSS and a small table, where each cell is a bar, and CSS dictates the cell color. Your code sets the class of each cell to “bar” or “nobar”.
<STYLE>
.bar , .nobar {
height: 10px;
width: 10px;
border: 1px solid gray;
border-collapse:collaps;
font-size: 1px;
/* Each cell has a non-breaking space in order to force it to render */
/* Setting font-size to 1px ensures that the height of the cell will be honored */
}
.bar{
background-color: #0000FF //Blue
}
.nobar{
background-color: #000077 //Dark Blue
}
</STYLE>
<SCRIPT>
function rssiMeter( bars , maxbars ){
var meter="<TABLE STYLE='border-collapse:collapse;'><TR>";
for(var i=0 ; i<maxbars ; i++){
var class=(i<bars)?"bar":"nobar";
meter+="<TD CLASS="+class+"> ";
//NO I DO NOT CLOSE MY TD TAGS. SUE ME
}
meter+="</TR></TABLE>";
return(meter);
}
// you can attach it to a DIV like this:
const maxbars=8; // define constants at the top of your script
const divname="meter";
function updateMeter( rssi ){
var bars = rssiToBars(rssi , maxbars); //maxbars is a global const
var meter= rssiMeter( bars , maxbars);
document.getElementById(divname).innerHTML=meter; //divname is a global const
}
// be sure there is <DIV ID=meter> </DIV>
// somewhere in your document
//Now, whenever you want to update your meter:
var rssi = somenumber;
updateMeter( rssi );
</SCRIPT>
updateMeter(-55);
would produce:
Enjoy!
I went down a rabbit hole trying to add a “favicon” (Web page icon) to an ESP32 web server project.
No one seems to have a complete answer, so here you go!
UPDATE: After I clicked “Publish” on the original version of this article, I started running in to all sorts of problems with my ESP32.
This sent me even deeper in to the rabbit hole, but I ultimately found a good solution.
Here is a step-by-step walk-through (UPDATED).
ESP32 – Use built-in LED and BOOT Button
Did you know that the ESP32 has a built-in user LED and Utility Button? No need to build a simple circuit to do testing.
Overview
The ESP32 is an amazing Arduino device that has lots of GPIO pins, plenty of CPU and memory capacity, as well as built-in WiFi and Bluetooth, and many other features.
- The ESP32 has a built-in LED on pin 2, which you can use freely.
- You can use the BOOT button on GPIO0 as a utility button.
| Interface | Description |
|---|---|
| ■ Power LED | Red when power is on |
| ■ User LED | Blue when activated by pulling GPIO2 HIGH. |
| ■ EN Button | “Enable”, normally HIGH. Pushing the button pulls LOW, which reboots. |
| ■ BOOT Button | When used with “EN”, causes the device to boot in to programming mode.
Normally GPIO0 is HIGH (Normal boot mode). Pushing the button pulls GPIO0 LOW (Enter programming / download mode). However, after the device boots normally, the BOOT button can be used to send input to GPIO0. |
I’ve always wanted to write my own tetris clone. I wrote one in javascript. To give it a retro feel, I implemented the game using text graphics.
Some ass hat took it upon itself to kill another human being because it didn’t agree with Charlie Kirk’s opinion.
This is a reprehensible act of terrorism designed to suppress free speech, committed by a deranged minority in a pathetic attempt to force the mainstream in to accepting their ridiculous ideology. In fact, this is more of a religion than an ideology, since religion requires nothing but faith.
So in addition to being an act of terrorism, this was also a religious hate crime aimed at mainstream America.
I choose to draw the line here.
I choose to reject some woke nutbag’s vision of what my world should be. I choose to reject the premise that I shall not speak up, lest I be struck down.
Please join me in celebrating Charlie Kirk the human being. Please join me in sending prayers and well wishes to his family. Please join me in rejecting ideological and religious extremism in all forms.
To those who disagree with me, I sincerely wish you a happy, peaceful life, and a peaceful soul. Please choose the path of peace. We need to build a world where people can use reason and logic, and disagree with eachother without killing eachother. We need to stop the hatred and the violence, and live with eachother in peace.