Anyone familiar with IT infrastructure operations will know the mantra of “the 3 things you must monitor for every server“. However, database engines use memory a little bit differently than other applications, and therefore what looks “bad” at first glance is simply functioning as designed.
Table of Contents
Server Monitoring
Anyone who has done hardware / OS support knows that you need to monitor these three things for every device:
- CPU utilization. As CPU hits 100%, servers and other devices can become lethargic, or simply stop responding.
- Memory utilization. As memory exceeds 100%, the operating system will start to perform “disk swapping”, where it takes least-used memory blocks and moves them to a disk file (called a swap file or page file) so that it can use “real” memory for whatever the application needs to do right now.
Swapping is really bad for performance, because disk writes are about 1,000,000 times slower than memory writes – disk writes are measured in milliseconds while memory writes are measured in nanoseconds. - Disk utilization. As the root or system partition fills up, the operating system becomes unstable and is likely to crash. As data partitions fill up, users risk data loss through file sharing or via an application process that writes data to the data partitions.
Without going in to the nuances of server, application, and performance monitoring, it’s easy to see that high disk (volume) utilization is a problem because it can result in data loss.
Therefore, monitoring for volume utilization above some threshold is normal practice – either above some percentage, or below some amount of total free space for each volume. For example, above 80% used, or below 1 gig free.
For CPU and memory, it’s not so cut-and-dried.
On a server with normal utilization, it’s not unusual to see brief spikes of CPU utilization that go all the way to 100%, but only for fractions of a second. Or, perhaps some application process running in the background kicks off, and the CPU jumps from a sustained 40% up to 70% temporarily, and then back down to 40%.
So, for CPU, a monitoring system would typically be tuned to look for sustained high CPU utilization, where the average is above some threshold, in excess of a specified period of time. For example, above 80% for 3 minutes would be a typical monitoring threshold.
Likewise, an application process will periodically allocate and free (de-allocate) memory as needed, where it’s normal for memory utilization to be “high” for some period of time, followed by a (usually pronounced) drop to normal levels.
However, because of the danger posed by excessive swapping, usually the server is tuned so that it always has some percentage of free memory, and the monitoring threshold would be set rather high, such as 90%. It’s also good practice to set a high sustained memory threshold, where a warning is generated if memory exceeds 80% for 5 minutes or similar.
This works great for an application server, that periodically allocates and de-allocates memory, but not for a database server.
Let’s take a look at this in detail…
Memory Allocation – App vs. Database
Note: The following are examples only and do not constitute normal quantities or recommendations.
Each combination of operating system and database server engine is unique in terms of footprint and requirements.
If we were to look at the memory map of an application server and database server, they would look about like this:
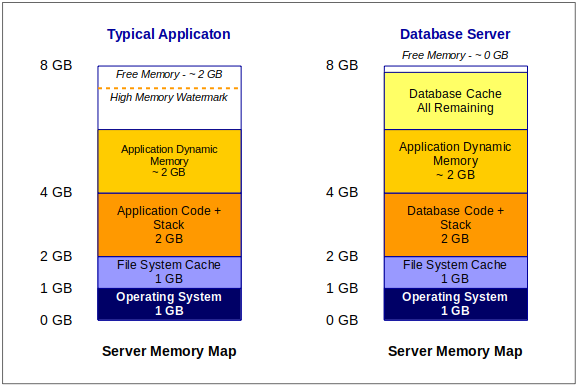
On both servers, the operating system loads first, and usually takes up 1 to 2 gig of memory. In our theoretical model, let’s just say it takes up exactly 1 gig.
Next, the OS allocates some memory for file caching. For simplicity, let’s say that’s another 1 gig. If this were a file server, and assuming your operating system supports it, you would make the file cache much larger.
The next thing that happens is that the OS loads the application binaries from disk in to memory, and executes the application. In the case of a database server, the database engine is the application.
Next, the application or database engine allocates some memory that it uses for processing.
In most applications, this all happens dynamically, and the software vendor makes a recommendation about the minimum and maximum amount of memory required to run the application.
In the case of a database engine, memory utilization is mostly able to be configured – known as tuning – so that the database takes up specific amounts of memory for different purposes.
Also, because databases are disk-intensive, the database engine usually uses caching, and allocates a big chunk of memory to storing data that was either recently read from disk, or temporarily storing data that will be written back to disk.
Comparing the two, it’s normal for an application to allocate and then free (de-allocate) memory based on demand, or based on the current tasks that need to be processed.
Conversely, a database server gobbles up as much memory for cache that it is allowed, and never gives it back.
Again, since disk IO is 1,000,000 slower than memory, the more memory that a database has available for caching, the faster it will run (generally).
For example, if we were to take our theoretical servers above, and double the memory, they would look like this:
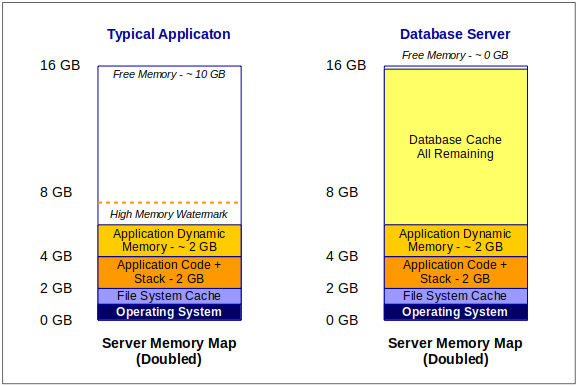
As we double our server memory, we see very little change on the app server, which was tuned properly to begin with.
If the app server is disk-intensive, you could use the extra memory to increase the file cache memory or perhaps create a RAM disk. You could also scale vertically by adding a second instance of the application, assuming they both play nice together on one server.
However, on the database, notice that the application memory stayed the same (because it was configured) but that the cache has taken all available memory!
At first, you might think that there is something wrong with the database server, since memory utilization will be above 90%. However, it’s simply using this extra memory to speed up disk reads and writes.
If we zoom in and look at how a normal application uses memory, we can compare that to a database engine, to understand why this is “normal”.
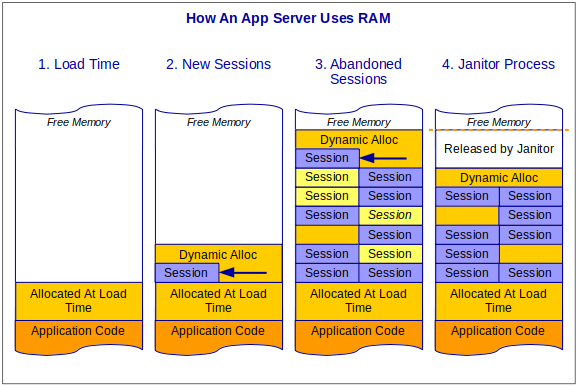
- Once an application loads and begins to execute, it immediately allocates some memory for global objects and variables, and for anything else that’s application-wide rather than session-specific.
- As the application accepts incoming sessions, it immediately allocates more memory to store session-specific information, such as your profile, what page you’re viewing, and what items are stored in your shopping cart.
- As the application hits its peak processing cycle, the server reaches its high watermark for memory utilization. Some sessions are stale or have timed out, and there may be “holes” where old sessions used to sit that the application can re-use as needed.
- Eventually, the application returns to a “normal” level of processing. Sometimes called a “janitor” process, the application will remove stale sessions, reorganize memory, and release unused server memory.
Steps 2, 3, and 4 repeat as necessary.
Comparing this to a database server:
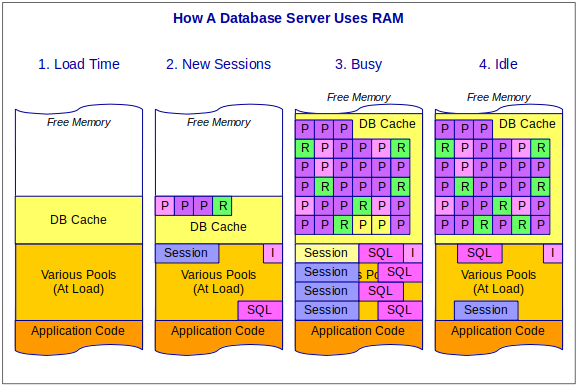
- When the database engine loads, it immediately allocates some memory for its various memory pools, and then allocates some memory for cache.
- The database engine’s memory pools track things like session information, store compiled SQL statements, and information about what indices are available for which tables and columns.
A database engine reads information to or from disk in “pages”, which are usually multiples of 4K bytes (4096). Some pages might hold index information (for example, light purple), while others hold table pages (purple), and yet others hold result sets that act like tables but are stored only in memory (green). - On a busy server, the database is constantly reading and writing pages, but since all of this goes through the cache, the more cache you have, the more pages it can hold. As needed, the database engine allocates more server memory for cache.
- As the database activity decreases to a near-idle state, a cleanup process gets rid of old sessions and stale objects just as an application does. However, it never releases cache back to the system. Instead, it keeps as many pages as possible in memory, just in case they are needed again.
For example, in the picture above, two stale pages at the bottom-right (3) have been replaced with a table page and a result set (4).
As new cache pages are needed, it finds stale pages or the oldest non-stale pages and overwrites them.
So, if you see that a busy database server’s memory map looks like this:
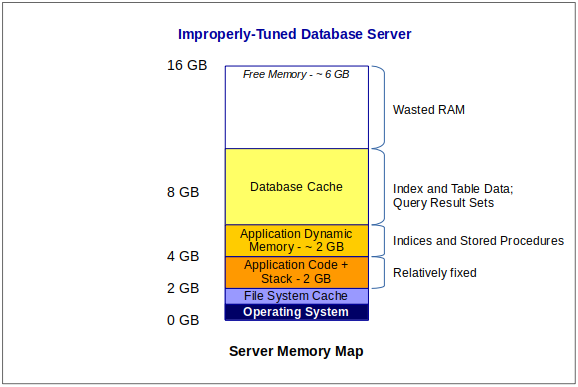
…either the database is very small and the server is over-sized, or the database engine isn’t properly tuned.
Any memory not used by the database is essentially wasted RAM.
Monitoring a Database Engine
Because it’s “normal” for a database to use all available server memory, proper monitoring can be a bit of a challenge.
Fortunately, most database software provides queries and other counters to look for:
- Insufficient cache (server needs more RAM)
- Memory pool exhaustion (increase tuning parameters)
- Inefficient queries (create indices or tune queries to make proper use of existing indices)
- Slow disk (consider multiple IO channels or faster disks)
To take advantage of these, your monitoring system will need to include a small database client that can either run these queries periodically, or otherwise extract these performance metrics from the database engine.